LFS Hotlap Analyser
LFS World Hotlap Analyser
Co je to
Na stránce LFS World je sekce věnovaná měřeným kolům (hotlaps). Tam můžete nahrát vaše nejlepší zajetá kola v módu Měřená kola a porovnávat je s ostatními hráči. Ke zlepšení vašich jezdeckých schopností zde existují tzv. programy Telemetrie, které vám posktyují technická data ohledně vašeho zajetého kola. Toto víceméně vyžaduje, abyste si nejdříve stáhli program pro analýzu, poté spustili LFS a ze záznamu hotlapu vyvořili výstupní soubor. Teprve potom můete tento speciální soubor otevřít v analyzéru
Pro zlehčení těchto úkonů byl do LFS Worldu přidán Hotlap Analyser, kde jen vyberete dva hotlapy nahrané na LFS World a okamžitě je můžete vyhodnotit a analyzovat bez dodatečného konvertování souborů.
Jak funguje
Výběr tratě a auta
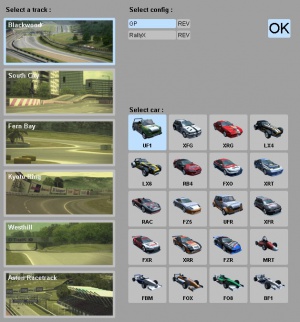
První, co uvidíte při spuštění programu, je výběr tratě a vozu. Here you must choose the track and car of the chart to wish to analyse hotlaps from.
You will not see this screen if you load the analyser through the compare function of the hotlap chart pages.
Once you have selected a track and car, you will then be presented with that chart. First to load the 'red' entry and then the 'blue' entry.
Menu bar options
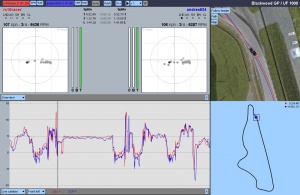
Starting at the left of the menu bar we find a red button with a name and a laptime in it. This shows you the first hotlap that has been loaded into the analyser. Click on it to load another hotlap in its place.
The two SPR and RAF buttons next to it allow you to download the LFS Replay (SPR) or the Analyser (RAF) files.
The blue button and its SPR and RAF buttons work the same way, for the second hotlap that you load into the analyser.
Next we find the Sync button. When activated, the analyser will sync both hotlaps by distance. That means that the cars will always appear at identical positions on the track as opposed to non-synced, where the hotlaps are just displayed over time.
The next button is the Km/h or Mph selector.
Then there is the New Graph button that will add a new graph view to the analyser. You can have a maximum of four graphs opened.
The Play/Pause button does what it's named after; it will start or pause replaying of the hotlaps. You can also press the space bar.
You can select playback speed via the pulldown menu, or by pressing 1, 2, 3 or 4.
The last button is named SF, which stands for Scroll Follow. When you are zoomed in on a graph and you are playing back, you can activate this option to let your zoomed graph(s) scroll along with the playback.
Track view
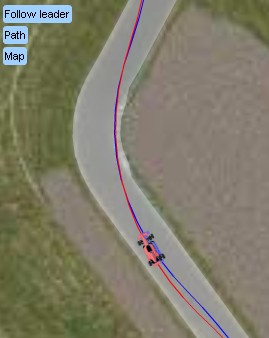
Here you can see the cars in motion and you can see their racing lines.
The Follow button allows you to follow a certain car while replaying, or follow no car at all. Options are Leader, Red, Blue or None. If None is selected you will be able to manually move the track map while replaying.
The Path button toggles the racing path on or off.
The Map button toggles the track map on or off.
You can zoom this view in and out with the mouse wheel. You can also move the map around with your mouse, unless you are replaying the hotlaps and following a car.
Graph views
First let us explain the buttons on the menu bar. The first button is a drop down menu to select a graph view type. The second button (X) is to close the graph view.
An additional Wheel drop down button will appear if you select a graph with wheel specific data.
There are different types of views that you can select, like graphs of course, but also some other views that show you more of a summary of information :
Overview
This gives you a lot of basic telemetry all in one view. Split times, speed, gear, RPM, clutch, throttle, brake and a Gforce meter are all available.
You can also see some options displayed that are abbreviated. These mean :
LHD - Left Hand Drive
AG - Auto Gear
SH - (manual) Shifter
BH - Brake Help
CL - (manual) Clutch
Wheel view
This is a 3D representation of the cars' wheels. You can see air temperature (air inside tyre), forces acting on the tyres (red means too much force) and you can view the lean of the wheels, though you might want to open the Live Camber graph for more detail.
The Follow Rotation button sets whether the objects will rotate along with the car (during replays).
You can rotate the 3D views manually by simply grabbing the objects and moving the mouse.
Note that if the Follow Rotation button is activated, you can only tilt the objects. Otherwise you can both tilt and rotate.
You can zoom in and out on the objects with your mouse wheel.
Setup info
Here you can find some basic setup information of each of the hotlaps. This is primarily useful to learn about gearing and suspension.
Graphs
These views display graphical representations of racing data. There are many to choose from. Some graphs will be wheel-specific. For these types of graphs you will see a wheel selector button.
Graphs are also used to scroll through the hotlaps. By clicking in a graph you can set or move the position indicator.
Graphs can be zoomed in and out with your mouse wheel. Note that while replaying you can let a zoomed graph follow the replay by enabling the SF option (Scroll Follow) located in the menu bar at the top of the analyser.
Some examples of what you can learn
Braking points
You can easily compare braking points. Turn on Sync and open the Brake graph. There you can see who brakes first in a corner. Or watch the brake indicators on the Overview window while scrolling through the replays (manually).
It is wise to not blindly trust a braking point though, also consider the exit speed of a racer. Braking too late is bad! The trick is to find the braking point that lets you exit the corner at the highest possible speed. You should brake just in time to enter the corner through the best possible driving line and speed.
It is therefore adviced to compare brake, throttle and speed at the same time.


