LFS Hotlap Analyser
LFS World Hotlap Analyser
Co je to
Na stránce LFS World je sekce věnovaná měřeným kolům (hotlaps). Tam můžete nahrát vaše nejlepší zajetá kola v módu Měřená kola a porovnávat je s ostatními hráči. Ke zlepšení vašich jezdeckých schopností zde existují tzv. programy Telemetrie, které vám posktyují technická data ohledně vašeho zajetého kola. Toto víceméně vyžaduje, abyste si nejdříve stáhli program pro analýzu, poté spustili LFS a ze záznamu hotlapu vyvořili výstupní soubor. Teprve potom můete tento speciální soubor otevřít v analyzéru
Pro zlehčení těchto úkonů byl do LFS Worldu přidán Hotlap Analyser, kde jen vyberete dva hotlapy nahrané na LFS World a okamžitě je můžete vyhodnotit a analyzovat bez dodatečného konvertování souborů.
Jak funguje
Výběr tratě a auta
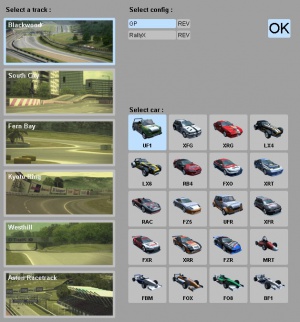
První, co uvidíte při spuštění programu, je výběr tratě a vozu. Zde si vyberete auto a trať, ze kterých poté budete vybírat hotlapy.
Tuto obrazovku neuvidíte, pokud spustíte analyzér přes funkci porovnání na stránce Hotpal Charts na LFS Worldu.
Když vyberete trať a auto, zobrazí se vám tabuklka s hotlapy. První vybíráte "červený" a poté "modrý" hotlap.
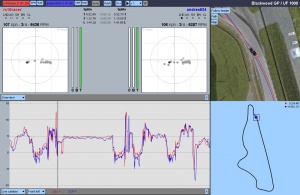
Na levé straně lišty najdeme červené tlačítko se jménem a časem kola. To je první nahraný hotlap do analyzéru. Kliknutím můžete místo něj nahrát jiný.
Dvě další tlačítka - SPR a RAF - umožňují stáhnout záznam (.spr) nebo soubory RAF.
Modré tlačítko a vedle něho druhé SPR a RAF tlačítka fungují stejně, ale jsou určeny pro druhý nahraný hotlap.
Dále tu máme tlačítko Sync. Když je aktivované, analyzér synchronizuje oby záznamy podle vzdálenosti. To znamená, že obě auta budou zobrazena ve stejné pozici na trati oproti nesynchronizovanému módu, kdy jsou auta zobrazena podle času.
Další jsou tlačítka pro výběr Km/h nebo Mph.
Potom tu je tlačítko, které přidá jeden nový graf do rozhraní analyzéru. Současně lze mít otevřeny až čtyři grafy.
Tlačítko Přehrát/Pauza asi není třeba vysvětlovat; přehraje nebo pozastaví záznam hotlapů. Tuto funkci také zastupuje mezerník.
Můžete si vybrat rychlost přehrávání z vysunovacího menu nebo stisknutím klávesy 1, 2, 3 nebo 4.
Poslední tlačítko s názvem SF znamená Scroll Follow. Když máte přiblížený některý z grafů a přehráváte záznamy, můžete tímto aktivovat synchronizaci aktuální pozice v záznamu s grafem.
Pohled na trať
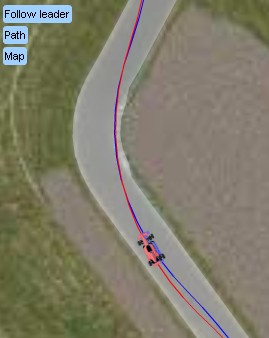
Zde můžete vidět pohybující se auta a jejich dráhy.
Tlačítko Follow vám umožňuje sledovat auto při přehrávání nebo sledování auta vypnout. Options are Leader, Red, Blue or None. If None is selected you will be able to manually move the track map while replaying.
The Path button toggles the racing path on or off.
The Map button toggles the track map on or off.
You can zoom this view in and out with the mouse wheel. You can also move the map around with your mouse, unless you are replaying the hotlaps and following a car.
Data views
First let us explain the buttons on the data view menu bar.
The first button is a drop down menu to select a data view type.
The second button (X) is to close the view.
An additional Wheel drop down button will appear if you select a graph with wheel specific data.
There are different types of views that you can select, like graphs of course, but also some other views that show you more of a summary of information :
Overview
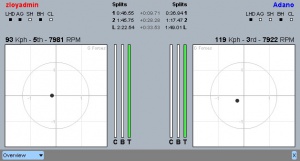
This gives you a lot of basic telemetry all in one view. Split times, speed, gear, RPM, clutch, throttle, brake and a Gforce meter are all available.
You can also see some options displayed that are abbreviated. These mean :
LHD - Left Hand Drive
AG - Auto Gear
SH - (manual) Shifter
BH - Brake Help
CL - (manual) Clutch
Wheel view
This is a 3D representation of the cars' wheels. You can see air temperature (air inside tyre), forces acting on the tyres (red means too much force) and you can view the lean of the wheels, though you might want to open the Live Camber graph for more detail.
The Follow Rotation button sets whether the objects will rotate along with the car (during replays).
You can rotate the 3D views manually by simply grabbing the objects and moving the mouse.
Note that if the Follow Rotation button is activated, you can only tilt the objects. Otherwise you can both tilt and rotate.
You can zoom in and out on the objects with your mouse wheel.
Setup info
Here you can find some basic setup information of each of the hotlaps. This is primarily useful to learn about gearing and suspension.
Graphs
These views display graphical representations of racing data. There are many to choose from. Some graphs will be wheel-specific. For these types of graphs you will see a wheel selector button.
Graphs are also used to scroll through the hotlaps. By clicking in a graph you can set or move the position indicator.
Graphs can be zoomed in and out with your mouse wheel. Note that while replaying you can let a zoomed graph follow the replay by enabling the SF option (Scroll Follow) located in the menu bar at the top of the analyser.
Some examples of what you can learn
Braking points
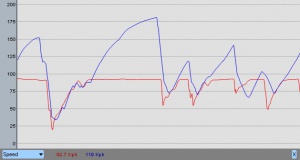
You can easily compare braking points. Turn on Sync and open the Brake graph. There you can see who brakes first in a corner. Or watch the brake indicators on the Overview window while scrolling through the replays (manually).
It is wise to not blindly trust a braking point though, also consider the exit speed of a racer. Braking too late is bad! The trick is to find the braking point that lets you exit the corner at the highest possible speed. You should brake just in time to enter the corner through the best possible driving line and speed.
It is therefore adviced to compare brake, throttle and speed at the same time.
